
TT#9: Cool Tools for a Heating World
A selection of new tools and databases offer excellent free resources for energy transition researchers, modelers, and advocates.

For a little change of pace, this week’s Transition Times is devoted to some interesting new tools and data sources that may be useful to you.
A relentless heatwave has been breaking records all across Europe this week, including the hottest day ever recorded in France, at 44.3° Celsius (112° Fahrenheit), and the hottest June day ever recorded in England, at 36°C (or 97°F).
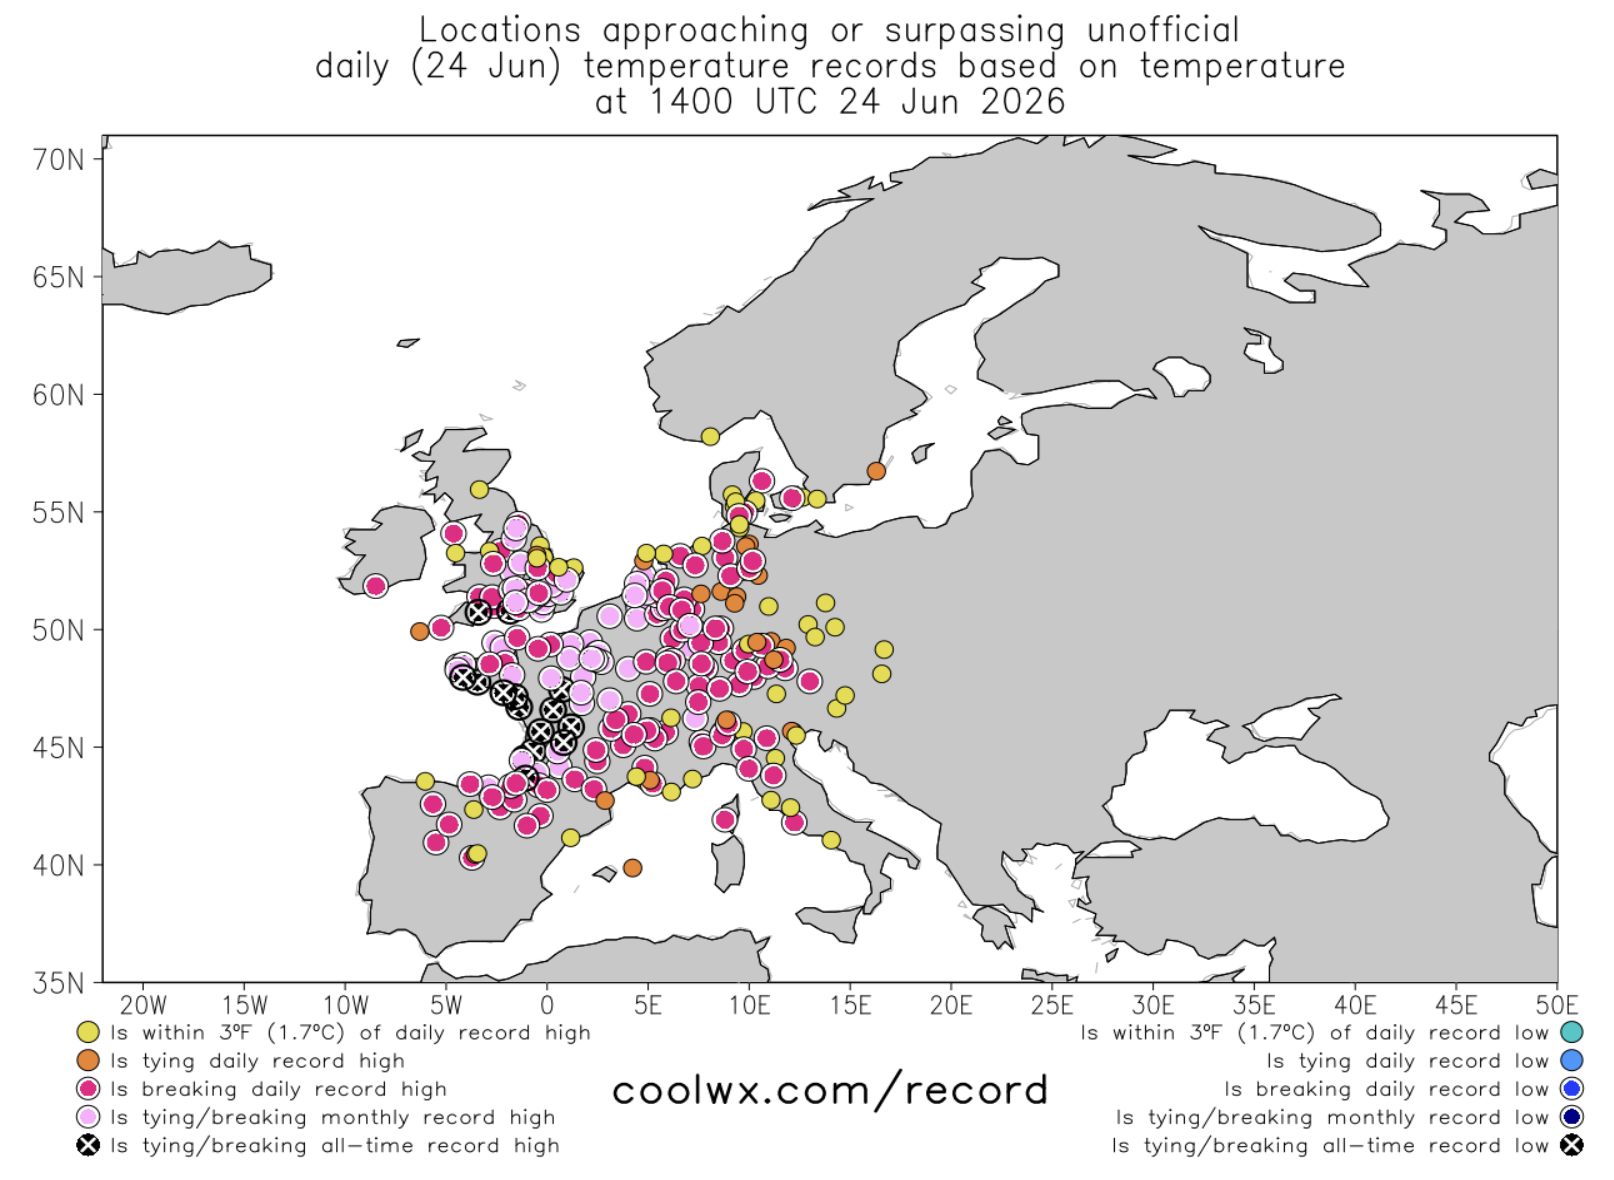
Source: https://coolwx.com/record/
So it’s timely that a new study just dropped counting up some of the financial costs of the extreme heat:
The Climate Analytics study shows that combined heat-and-drought events already reduce average household incomes by almost 3% across Europe, with much larger losses in the hardest-hit regions. It reveals that rising global temperatures will widen income inequality and put millions more Europeans at risk of poverty. If global warming reaches 2.7°C by 2100, as is likely under current policies and action worldwide, the average European household will see its income fall by 27%. Limiting global warming to 1.5°C, the Paris Agreement commitment, would slash this to 7%.
But that’s not all. Combine the extreme heat with drought, and the damage can be much greater. And these ‘compound events’ “will become more frequent as global warming increases,” according to the press release.
Climate Analytics, with an international team of 130 experts and support staff, produces science and analysis on climate impacts, the energy transition, adaptation and loss and damage to help inform national policies around the world. So if you are working on national climate policy anywhere in the world, you may find their reports helpful.
Climate data sources
Another new resource for data on climate science is the latest project from Carbon Brief called Project Cosmos. After a year and a half of research and development, they have assembled what they call “the world’s largest database of climate change research”:
Containing more than 1.8 million unique publications linked by 40 million citation relationships, the Cosmos database represents the most complete and expansive mapping of human knowledge on climate change ever assembled.
The website has an interactive infographic that you can use to explore the publications, which feels similar to exploring visualizations of the stars in a galaxy. It also has a ranking of the 500 most-cited authors, publications and institutions, and interviews with some prominent climate scientists. It’s really a remarkable piece of work and should be useful to anyone doing climate research.
Last year, as part of the DOGE cutbacks orchestrated by Elon Musk, the Trump administration shut down the Climate.gov website that had been a trusted source for official government climate data. It was built by the National Oceanic and Atmospheric Administration (NOAA)—the government's lead scientific agency for climate, weather and ocean monitoring—which also had more than a thousand of its employees and numerous contracts related to research, satellite data, observations, and climate programs canceled by DOGE. Nearly 1 million visitors came to the site each month, according to 2021 numbers.
Since then, most of the data has remained technically accessible on government servers, but was difficult to find, according to Rebecca Lindsey, a former program director for Climate.gov.
So in August 2025, she and two other former NOAA employees who helped run the government site began to re-create it. And now they have launched it as Climate.us, with the help of about $280,000 in crowdsourced funds and a one-time grant from an anonymous donor. Numerous volunteers, including about 80 scientists, serve on the group's science panel and fact-check what the site publishes.
The new site re-creates the old "climate dashboard" on the government site that contained more than a dozen key graphs related to climate change. It also features Climate.gov's 15-year collection of climate news and stories, expert blogs, visual status reports on key climate indicators, maps and data pathways, climate literacy resources and classroom materials, according to the site.
Electricity data sources
Ember has launched another new project called the “Solar + Battery Atlas,” featuring an interactive tool that lets you see what solar and batteries can do across the world. It demonstrates how the main difference across regions is storage need and cost, not technical feasibility. They explain:
We divided the world into 5,000 regions, each about the size of Belgium, and in each calculated the solar and batteries needed to serve a constant 1 MW load in every hour of the year, and what that costs.
This is a sceptic’s test. The model includes no demand shifting, no grid imports, no wind, no hydro and no backup. Just solar, batteries and a flat load. In reality, power systems have far more options: demand varies by hour, grids trade across regions, customers shift some use and the grid already has other generating technologies. If solar and batteries can hold a flat load alone, a real system can only do better.
The results show that solar plus batteries can already deliver high-uptime power across much of the world, at competitive cost, especially in the places where demand is growing fastest. What follows are nine findings.
Their findings are startling and clear: By 2030, solar with batteries can deliver power at 80% uptime to around 80% of the world for less than $80/MWh. For half of humanity, it is already under $80. And it’s now the cheapest way to provide power for the roughly 760 million people in the world who still lack it.
If this sounds familiar, it may be because this study is an update of one Ember did a year ago that did similar modeling on just 12 locations in the world. Or because that study inspired Tom Brown of the Technical University of Berlin to run his own simplified model of how solar and batteries can power the world, which we covered in Energy Transition Show Episode #273 in April.
Ember also offers an Electricity Data Explorer and an API, launched last year, that anyone can use to explore their extensive, free dataset on global electricity demand, generation, capacity and CO2 by country. They also offer provide a host of other data covering the energy transition, including monthly data on solar and wind capacity by country, solar PV exports and other cleantech exports from China, and much more.
Great Britain’s National Energy System Operator (NESO) has also released a new website called the ESO Data Portal, offering free, publicly available live and historic electricity system data for Great Britain, from carbon intensity to demand forecasts:
The ESO Data Portal is National Grid's central hub for sharing Great Britain's electricity system data, including demand, generation mix and carbon intensity, in near real time. The official portal overview sets out datasets for historic records and forecasts that analysts can download or query via API.
On a typical weekday, system operator teams led by ESO chief engineer Julian Leslie watch these dashboards as they balance supply and demand second by second. You see the total load curve rise towards the early-evening peak and the portal lists which technologies carry the strain, from gas plants to offshore wind farms.
National Grid built the ESO Data Portal primarily for energy market participants, academics and developers who need reliable, structured data rather than glossy graphics. The interface is tidy, with clear dataset tiles, filters and documentation sections, so you are never more than a few clicks from a CSV or API endpoint. The carbon intensity dataset page shows how each dataset is described with methodology and update frequency.
To learn more about NESO’s incredibly ambitious effort to coordinate the planning and evolution of all of Great Britain’s energy networks, listen to Julian Leslie’s appearances in Energy Transition Show Episodes 174 and 245.
Finally, although it's been around for years, it doesn't get enough recognition so I'll give a shoutout to Global Energy Monitor. Their free, open-source data set covers more than 182,000 energy facilities worldwide. They also offer dozens of interactive maps and data dashboards, expert analysis on the energy transition, and a number of “energy transition trackers” that make it easier to see how the energy transition is proceeding by technology, region, and more. Check them out!
Got an item you’d like us to cover?
We’d like Transition Times to help increase the visibility of all the great work that’s being done out there. So if you have an article, report, study, podcast episode, newsletter post, video clip or anything else that you think is worthy of a shout-out in Transition Times, email it to suggestions [at] transitiontimes [dot] net! We welcome all submissions, as long as they’re relevant to the energy transition.
Sources
“The 2026 European Heatwave by the Numbers,” Weather On This Day, June 27, 2026.
Nazaneen Ghaffar, “Europe Is Sweltering in an Extreme Heat Wave. Here’s the Latest.” The New York Times, June 23, 2026.
“Hottest June day on record for the UK as temperature reaches 36C,” BBC, June 24, 2026.
(Unofficial) Record-breaking temperature across the Globe, CoolWX, June 24, 2026.
Press release: “As heatwave sweeps Europe, study warns of growing toll on household incomes,” Climate Analytics, June 24, 2026.
Scott Neuman, “Ex-NOAA employees re-create a valuable climate data site shut down by Trump,” NPR, June 26, 2026.
Jessie Ruth Schleypen, Fahad Saeed, Anne Zimmer, and Tilman Brück, “Compound dry-and-hot extremes exacerbate income inequality and poverty in Europe,” Global Environmental Change, Volume 97, May 2026. https://doi.org/10.1016/j.gloenvcha.2025.103106
Project Cosmos, Carbon Brief.
Solar + Battery Atlas, Ember.
Kostantsa Rangelova, “Harnessing the Sun: The Solar + Battery Atlas,” The Electrotech Revolution, June 18, 2026.
Daan Walter, “Prototyping data tools with AI, a case study: Solar + Battery Atlas,” Ember, June 19, 2026.
Episode #273 – Solar and Batteries Can Power the World, Energy Transition Show, April 8, 2026.
“The ESO Data Portal from National Grid PLC - live grid insight for UK power users,” Ad Hoc News, June 27, 2026.
Episode #174 – Decarbonizing Britain’s Grid, Energy Transition Show, June 8, 2022.
Episode #245 – Evolving the UK Energy System Part 3, Energy Transition Show, March 12, 2025.